Every year, organizations spend billions on production security — patching, monitoring, incident response — yet 67% of critical vulnerabilities trace back to decisions made during architecture design. What if you could see those attack paths before writing a single line of code?
The Reactive Security Trap
The security industry has conditioned us to accept a reactive posture. Deploy, scan, patch, repeat. Penetration tests run quarterly at best, finding vulnerabilities that have been live in production for months. Bug bounties pay strangers to find what your architects should have prevented.
This isn't a failure of tools — it's a failure of timing. SAST, DAST, and SCA tools are excellent at what they do, but they operate after code exists. The architecture decisions that create systemic risk are locked in long before a scanner ever runs.
Consider a typical microservices deployment: if an architect places a shared database behind two services without proper network segmentation, no amount of code scanning will flag the lateral movement opportunity. That's an architecture-level vulnerability, invisible to code-level tools.
What If You Could See Attack Paths in Your Architecture?
Ayurak's attack path simulation takes your system architecture — a diagram, a Terraform file, a Kubernetes manifest — and models how adversaries would actually traverse it. Not theoretically. Statistically.
Step 1: Upload or Generate Your Diagram
Start with what you have. Upload an existing architecture diagram, import Infrastructure-as-Code, or describe your system in natural language. Ayurak's AI reconstructs the topology: components, trust boundaries, data flows, and external interfaces.
Every component is automatically classified — API gateway, database, message queue, ML inference endpoint — and assigned baseline security properties based on industry data and known configuration patterns.
Step 2: MITRE ATT&CK Mapping Per Component
Each component in your architecture receives a set of applicable MITRE ATT&CK techniques. An exposed REST API might map to T1190 (Exploit Public-Facing Application), T1059 (Command and Scripting Interpreter), and T1078 (Valid Accounts). A Kubernetes pod maps to container escape techniques. An S3 bucket maps to data exfiltration tactics.
This isn't a generic checklist. The mapping is contextual — it considers the component's role, its network position, its data sensitivity classification, and its connections to other components.
Step 3: Monte Carlo Simulation (5,000 Iterations)
Here's where it gets interesting. For each identified attack path, Ayurak runs a Monte Carlo simulation with 5,000 iterations using Bernoulli trials. Each trial models a single attack attempt across a chain of components, where each step has a probability of success based on:
- The component's security controls (authentication, encryption, segmentation)
- Known vulnerability density for that technology stack
- The attacker's capability multiplier (see Step 4)
- Environmental factors (network position, exposure level)
After 5,000 iterations, you get a probability distribution for each attack path — not a binary "vulnerable/not vulnerable" but a nuanced probability curve. A path with a 73% success rate across iterations is qualitatively different from one with a 12% rate, even if both are technically "possible."
Step 4: Attacker Profiles
Not all attackers are equal. Ayurak models four distinct attacker profiles, each with a capability multiplier that adjusts success probabilities across all Bernoulli trials:
- Script Kiddie (0.4x multiplier) — Uses publicly available exploits and automated tools. Limited ability to chain vulnerabilities or adapt to defenses. Stops at the first hardened boundary.
- Cybercriminal (0.7x multiplier) — Motivated by financial gain. Can purchase zero-days from markets, use social engineering, and persist through basic defenses. Will invest days to weeks.
- Organized Crime (1.0x multiplier) — Baseline reference. Dedicated teams with custom tooling, insider access capabilities, and multi-month campaign timelines. Can chain complex attack paths.
- Nation State (1.3x multiplier) — Effectively unlimited resources. Can develop zero-days, compromise supply chains, and maintain persistent access for years. Assumes capability to bypass any single control.
Running the simulation across all four profiles reveals which defenses matter at each threat tier. A control that stops script kiddies but fails against organized crime needs different investment prioritization than one that's effective across all profiles.
Choke Points: The Security Multiplier
The most powerful output of attack path simulation isn't the list of vulnerabilities — it's the identification of choke points. A choke point is a component that appears on multiple high-probability attack paths. Hardening a single choke point can reduce overall compromise probability more than fixing a dozen individual vulnerabilities.
Think of it like a road network. If three highways all pass through one bridge, reinforcing that bridge protects all three routes. Ayurak's simulation identifies these architectural bridges automatically, ranking them by the number of attack paths they influence and the aggregate probability reduction from hardening them.
"We found that hardening our API gateway — a single component — reduced the overall compromise probability across 14 attack paths by an average of 41%. No code-level scanner would have told us that." — Security Architect, Series C FinTech
The "Turn Red Paths Green" Experience
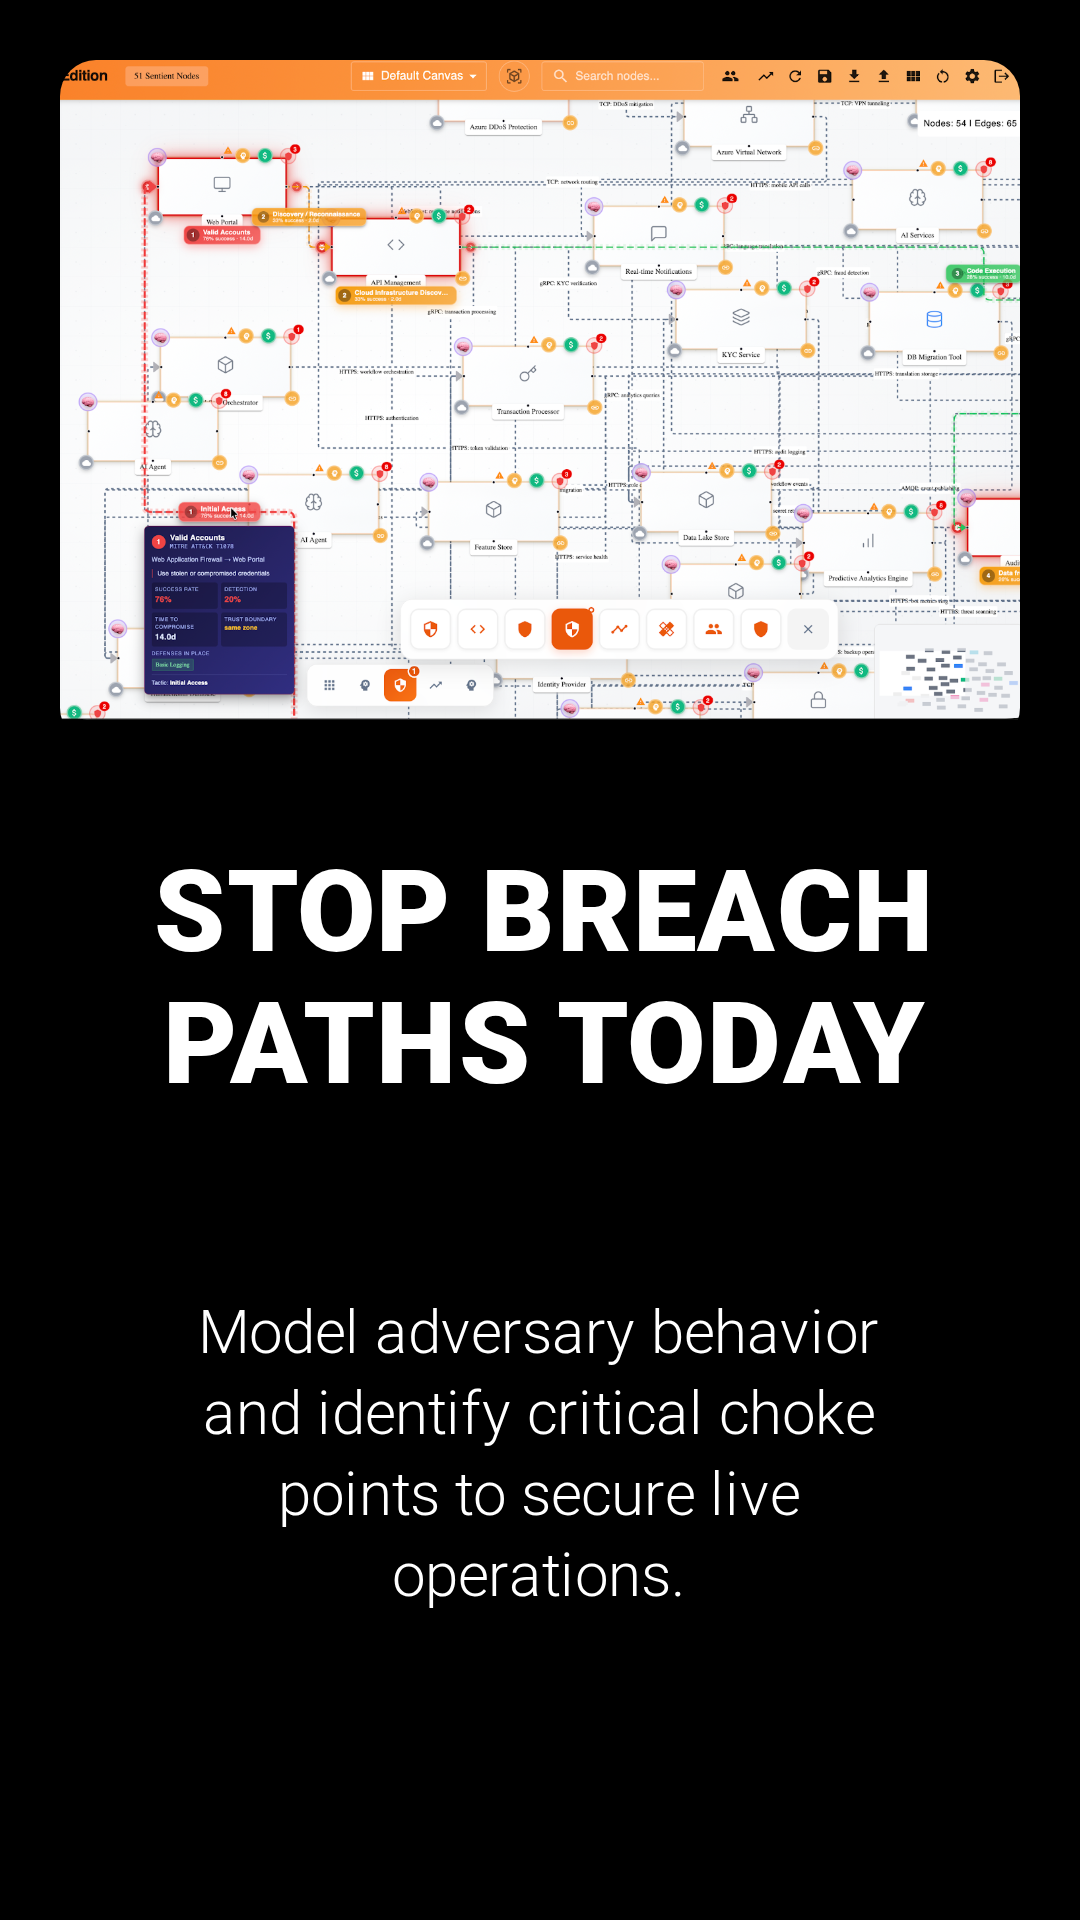
Ayurak visualizes attack paths directly on your architecture diagram. High-probability paths glow red. Medium paths show amber. Low-risk paths are green. The goal is intuitive: turn red paths green.
Click on any red path to see the specific chain of techniques an attacker would use, the probability at each step, and recommended mitigations. Apply a mitigation — add encryption, enforce mTLS, segment the network — and watch the simulation re-run in real time. The path changes color as the probability drops.
This creates a feedback loop that makes security tangible for architects and engineering leaders who aren't security specialists. You don't need to understand MITRE technique IDs. You just need to make the diagram green.
A Concrete Example: ML Inference Platform
Consider a machine learning inference platform with three identified attack paths:
- Path A: External API → Model Server → Training Data Store
Probability: 68% (Nation State), 31% (Cybercriminal)
Risk: Training data exfiltration, model poisoning - Path B: CI/CD Pipeline → Container Registry → Production Pods
Probability: 54% (Nation State), 22% (Cybercriminal)
Risk: Supply chain compromise, backdoored model deployment - Path C: Employee VPN → Internal Dashboard → Admin API → Database
Probability: 47% (Nation State), 19% (Cybercriminal)
Risk: Full infrastructure compromise via credential theft
The simulation identifies the Model Server as a choke point — it sits on Paths A and B and has the highest individual step-probability. Recommendations: enforce mTLS between API gateway and model server, implement request signing, add anomaly detection on inference patterns.
After applying mitigations in the diagram, re-running the simulation drops Path A to 23% (Nation State) and 8% (Cybercriminal). Path B drops to 31% and 11% respectively. One architectural change, two paths significantly hardened.
Why Design-Time Security Saves 100x
The economics are brutal and well-documented. The cost to fix a security flaw scales exponentially with the phase in which it's discovered:
- Design phase: $500 — an architect changes a diagram
- Development phase: $5,000 — a developer refactors code
- Testing phase: $15,000 — QA cycles, regression testing
- Production: $50,000+ — hotfix, incident response, customer notification
Attack path simulation catches architecture-level flaws in the design phase. A 20-minute simulation session that identifies a missing trust boundary saves the cost of discovering that same flaw as a production incident six months later.
This Isn't a Replacement for Pen Testing
Let's be clear: attack path simulation complements, not replaces, traditional security testing. Penetration tests validate real-world exploitability. SAST/DAST tools catch implementation bugs. SCA scanners find vulnerable dependencies.
What simulation does is shift the first line of defenseearlier. By the time code reaches a pen tester, the architecture is already hardened. The pen test findings shift from "your architecture allows lateral movement" to "this specific endpoint has an injection flaw" — targeted, fixable issues rather than systemic design failures.
Organizations using design-time simulation report that pen test findings decrease by 40-60% in severity, because the critical architecture-level issues are already resolved.
Getting Started
You don't need a perfect architecture diagram to begin. Start with what you have:
- A whiteboard sketch photographed and uploaded
- An existing Terraform or CloudFormation template
- A Kubernetes manifest or Helm chart
- A natural language description of your system
Ayurak's AI reconstructs the topology, applies MITRE mappings, and runs the simulation. Your first results appear in under five minutes. From there, iterate: harden choke points, re-simulate, and watch your attack surface shrink in real time.
The best time to find an attack path is before it exists in production. The second best time is right now.
Try Attack Path Simulation
Upload your architecture diagram and see how adversaries would traverse your system — before you write a single line of code. 5,000 Monte Carlo iterations, four attacker profiles, actionable choke point analysis.
Try Attack Path Simulation