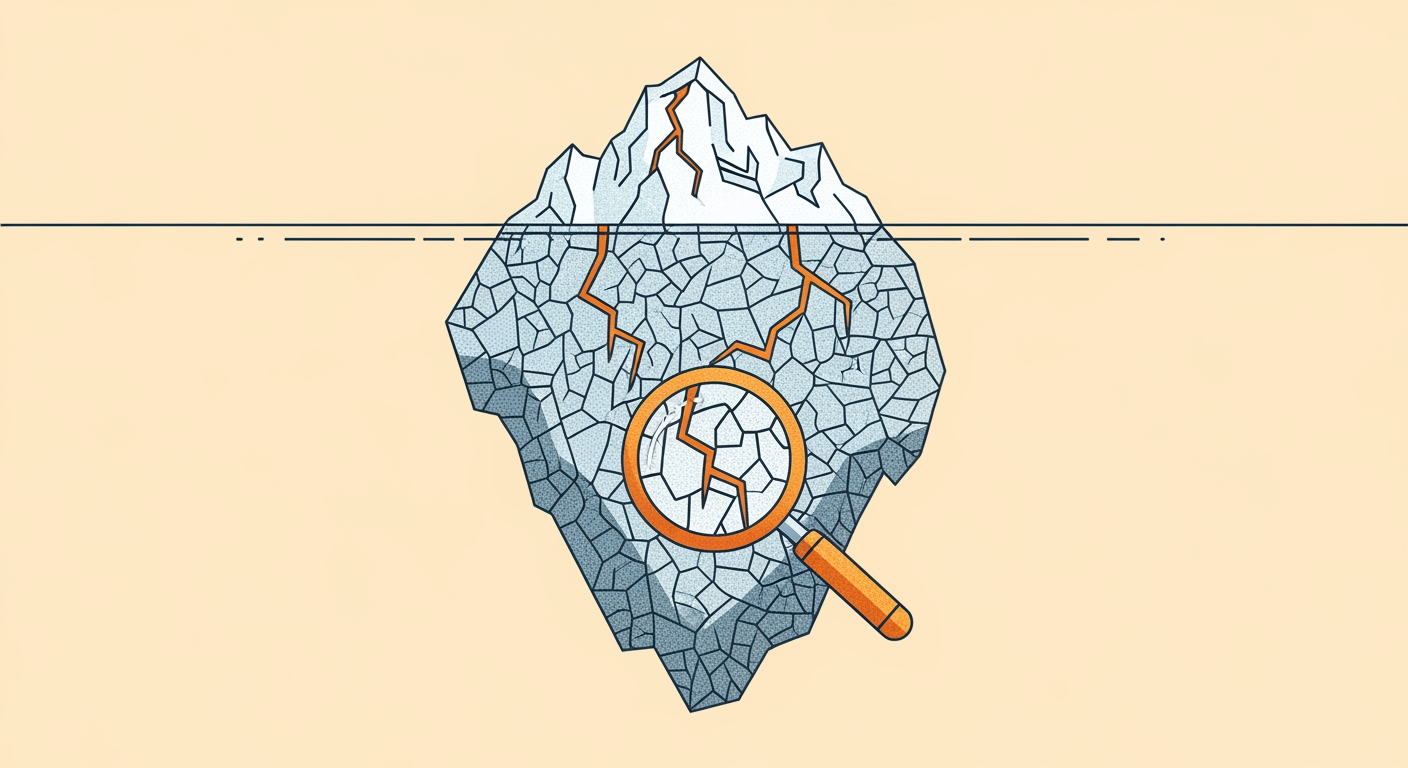
The most dangerous outage is the one nobody sees. Not the loud, pager-screaming kind — the quiet kind, where a health check returns 200 OK while the thing it is meant to protect has been broken for weeks. Over one recent fortnight we logged six of these in our own stack. Zero surfaced through monitoring. All six were found by a person stumbling onto the symptom.
The asymmetry that breaks monitoring
Classic monitoring answers one question well: is the service up?It pings an endpoint, checks a status code, watches CPU and memory. That catches the failures where a process dies or a host falls over. It is almost useless against a different and more common class of failure: the service is up, responding, and confidently wrong.
A login page that renders perfectly but rejects every one-time password. A catalogue that returns 200 with an empty body. A background job that runs on schedule and quietly does nothing. The process is healthy. The business outcome is dead. Your dashboards stay green because they were never asked the question that matters.
Six silent breaks in fourteen days
These are real, from our own production logs. We share them because every team has its own version of this list — most just haven't gone looking yet.
A database password drifted between our secret store and the running cluster. The driver failed authentication silently and served empty results. The health probe — which only checked that the API answered — stayed green for weeks while every profile page was blank.
A CAPTCHA site key was rotated in one console. Four other places still held the old value. New-user phone verification failed for every Indian sign-up, and nothing in the pipeline noticed the four surfaces had fallen out of lockstep.
A default-paused flag never flipped on. Leads aged in a queue for over two months. Resuming the flow in one flush would have torched the sender's reputation in a single send.
Dead machine-learning endpoints scanned 226 MB per call, sixteen hundred times a day, until they blew through the daily cap by mid-morning. The home page started returning 500s — the first signal anyone saw.
An alert query gated on a column that no shipped code path ever wrote. The result: a steady stream of false alarms that trained the team to ignore the alert entirely.
An old service worker kept serving bundle hashes that no longer existed in the build. Users got a blank screen until they manually hard-refreshed. No automated signal fired.
Look at the common thread. In every case the system knewsomething was wrong — an auth error, a quota counter, a chunk-load failure beacon — and had no way to tell anyone, and no way to fix itself. The information existed. It just never travelled from the place that had it to the people who could act on it.
Why these slip through
Health checks test the wrong layer
A probe that confirms the API returns a response is not the same as a probe that confirms the API returns the right response. Most liveness checks were written to satisfy a load balancer, not to catch a broken business outcome. They answer “is the door open?” when the question is “is anyone behind the counter?”
Drift is invisible by definition
A value that is correct in one place and stale in another produces no error until something reads the stale copy. Configuration spread across a secret manager, a cluster secret, a pod's environment and a vendor console will, over time, fall out of sync. Nothing alerts on “these four things used to agree and now they don't.”
Alert fatigue eats the real signal
When a noisy alert fires on every sign-up, the team mutes it. The one time it means something, it is already in the ignore pile. A monitoring system that cries wolf is worse than no monitoring at all, because it actively erodes trust in the channel.
From watching to acting
The fix is not more dashboards. Adding a screen nobody watches to the wall of screens nobody watches changes nothing. The shift that matters is from a system that observes to one that acts: probes the real upstream behaviour, compares the surfaces that are supposed to agree, and when it finds drift, repairs it and tells a human exactly what it did.
That is the premise behind self-healing infrastructure. Not autonomous magic — a tight, auditable loop with a hard contract: detect against the real dependency, classify the failure, repair behind a captured rollback point, verify the repair actually worked, and escalate loudly whether it succeeded or failed. If the repair doesn't make things better within about two minutes, it rolls back to a known state.
The next piece breaks down the five-phase contract that turns each of these silent breaks into a thirty-second auto-repair with a full audit trail.
Read: The Five-Phase Self-Healing ContractThe uncomfortable truth in our fortnight of failures is that none of them were exotic. No zero-day, no nation-state, no clever exploit. Just drift, stale caches, runaway costs and a paused flag — the ordinary entropy of running software. The systems were new. The failure modes were ancient. What was missing was a loop that closed on its own.